
General info
The “Forecast“ module enables you to estimate future revenue based on current and historical financial data. Forecasts are monthly-based revenue predictions and can be created for the total of your customers and also include historical data that is both displayed in the module as well as contrasted with the originally forecast values.
PLEASE NOTE: Any created forecast is automatically saved. Therefore, only click “Finalized“ once you’ve made sure that all entered data is correct, as finalized forecasts cannot be edited any more.
Steps
- Go to “Finances“ > “Forecast“
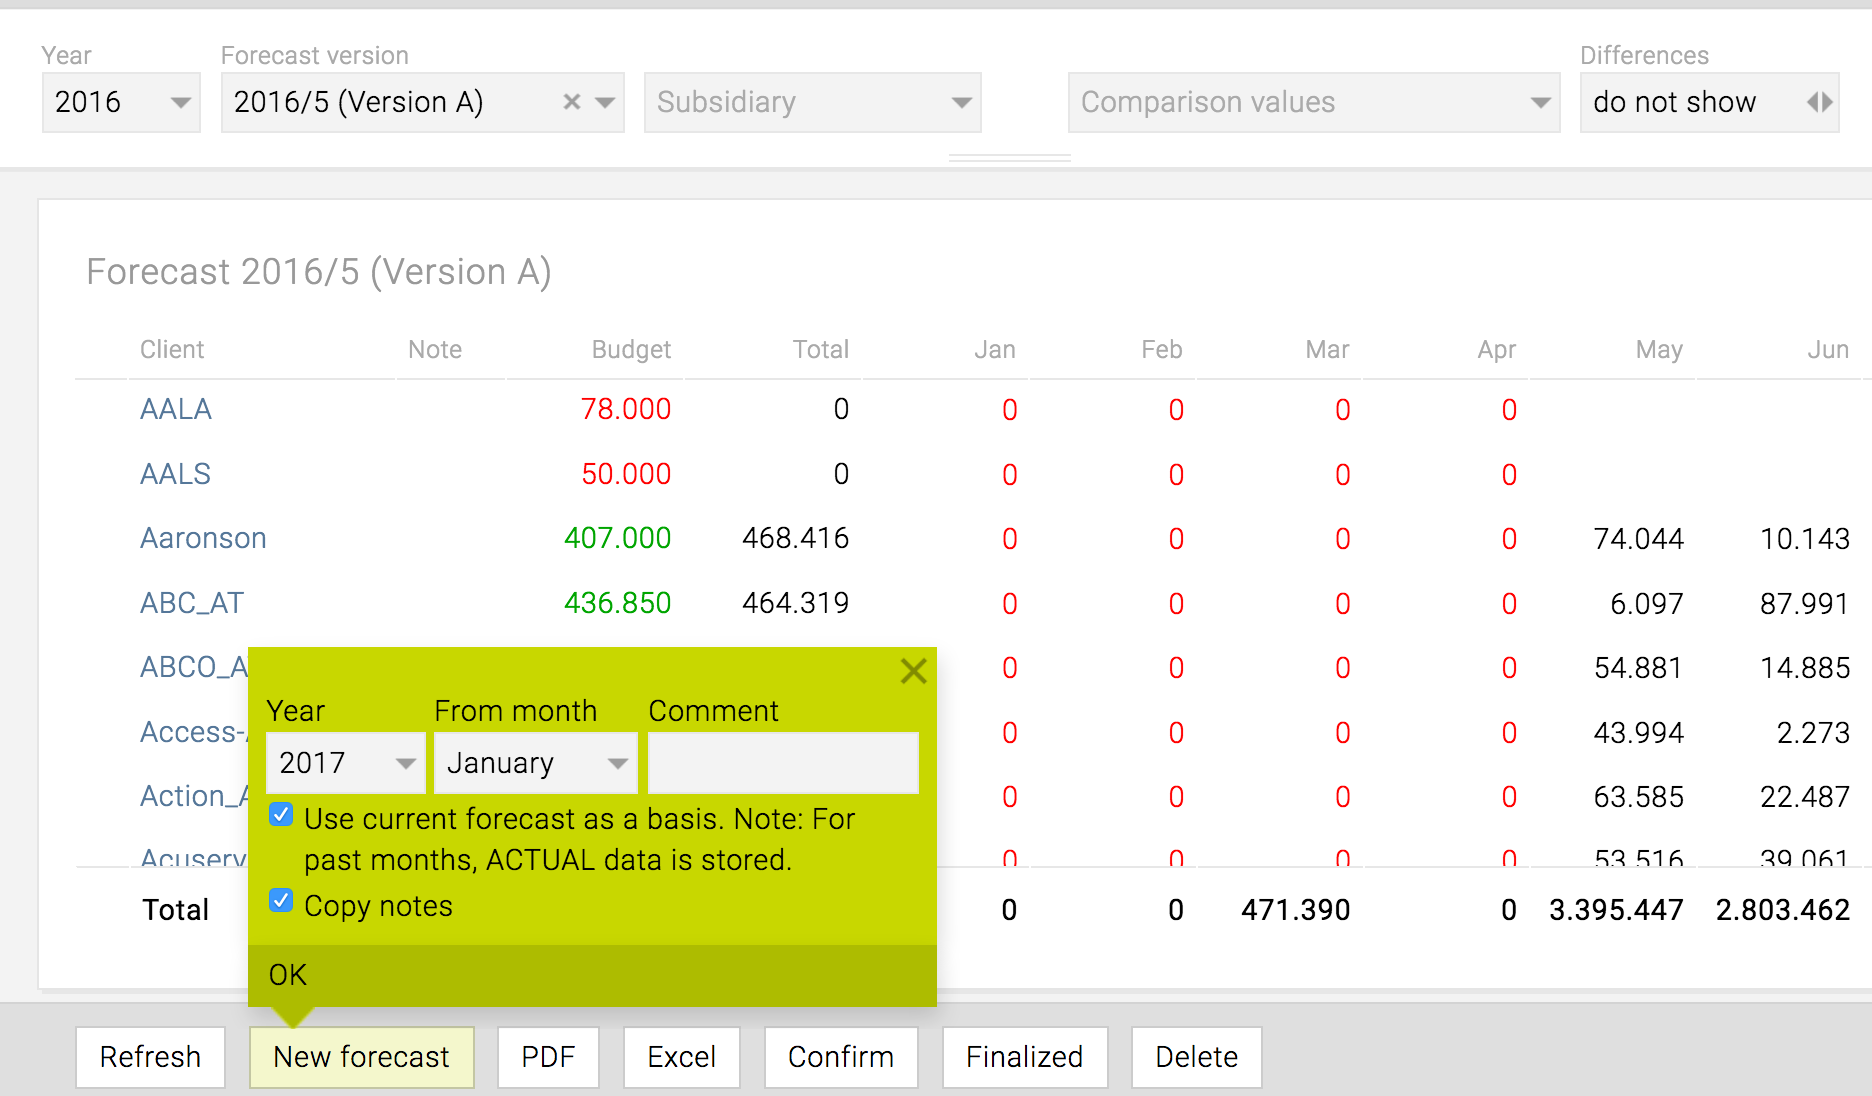
- Click the button “New forecasts“ at the bottom of the screen
- Choose a (future) base date from the pop-up and click “Ok“
HINT: enter a “Comment“ to facilitate distinguishing similar versions from each other
=> Depending on the selected month, the displayed table will contain historical financial data to one side and empty columns for the upcoming months on the other side
HINT: The historical data reflects the actual revenue and is colour-coded:- green font colour => more revenue achieved than planned in „Forecast“:
- red font colour => less revenue than planned
HINT: Hover over the coloured numbers to display the originally forecast value
- Choose the relevant data type from the drop-down “ACTUAL data according to“ for your historical data:
- “Invoice date“ will group the revenue based on the month the invoices were issued
- “Service provision“ groups the numbers according to the month the service was provided in
- Next, enter your predicted values for one or several clients and one or several future months in the empty cells – you can do so on:
- client level (i.e. enter the values in the cells => highest level)
- area level (i.e. click the client name and enter the values in the cells => lower level; below client level)
- job level (i.e. click the area name and enter the values in the cells => lowest level; below area level)
HINT: If you enter figures at the highest level (i.e. client level), these figures will not be aggregated on lower-level cells;
HINT: If you enter figures at a lower level with already entered figures on a higher level, the affected cells will be coloured red and a mouse-over warning is displayed (i.e. “Warning: Amounts have already been entered at a higher level“); however, these cells can be edited anyway, despite the warning
HINT: If you enter figures at a lower level (i.e. from job to area level and from area to client level), these WILL be aggregated on their higher levels, are displayed in a grey font on the higher levels and are write-protected on that higher level
- Once you have entered all your figures for your forecast AND have made sure the numbers are correct, these numbers are automatically saved, irrespective of navigating away or logging out.
- Depending on your user permissions, use the confirmation workflow to pass on finalizing to another member of staff with the relevant permissions or click “Finalized“.
WARNING: Once a forecast has been finalized, it cannot be edited any more.
=> The forecast has been finalized and is ready for use.