Steps
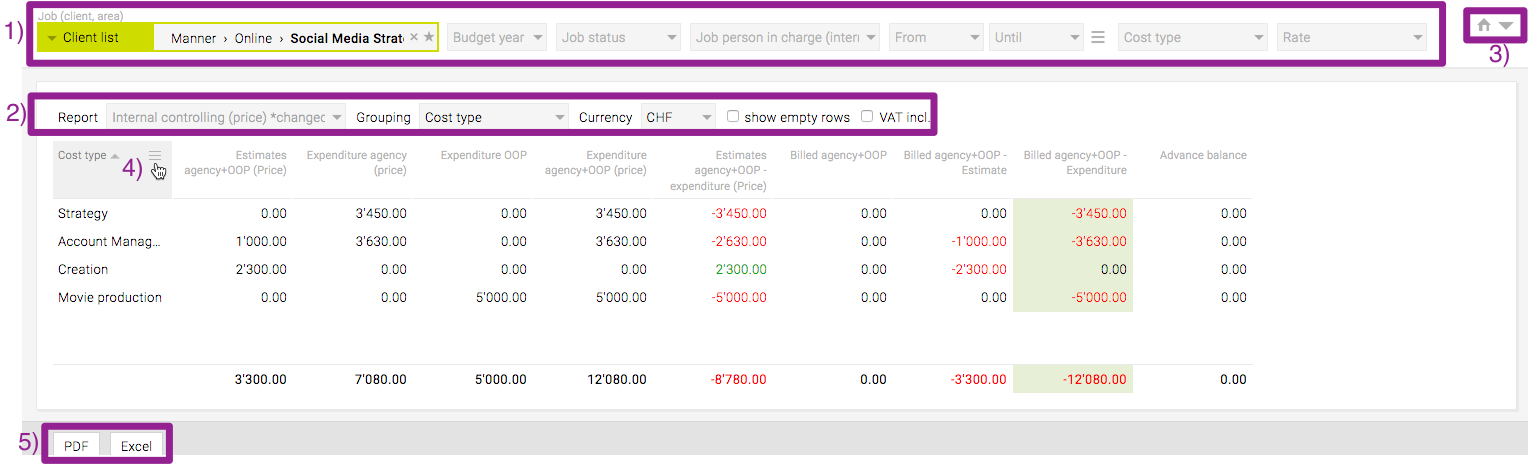
- (1) Go to “Finances” > “Controlling” and filter for specific entries by “Budget year”, “Client”, “Area” and “Job”. Now, you can fine-tune which data is displayed in which way.
- (2) Choose a pre-defined report from “Report”, change how the data is grouped in “Grouping” or change the currency of the displayed data in “Currency”
- Select “show empty rows” to include data for which no entries have been created yet
- Select “VAT incl.” to display all figures inclusive of VAT
- (3) Click
![]() to display even more filtering options; clicking
to display even more filtering options; clicking ![]() will clear your search
will clear your search - (4) The columns can be sorted in ascending or descending order, such as the first column by clicking the
![]() icon
icon
- Moving your cursor over the column titles will display a
![]() icon; clicking this will open a window where you can select more columns either via drag & drop from the left list to the right list, or by double-clicking in combination with drag and drop.
icon; clicking this will open a window where you can select more columns either via drag & drop from the left list to the right list, or by double-clicking in combination with drag and drop. - Click “Save” to apply all changes.
- Moving your cursor over the column titles will display a
- (5) Clicking the button “PDF” or “Excel” at the bottom of the page will export the controlling list as PDF or Excel file