
General information
There are three options to visualise progress details for current jobs in “Jobs” > “Job portfolio”:
- Finance cloud
- Activity cloud
- Combi-Chart
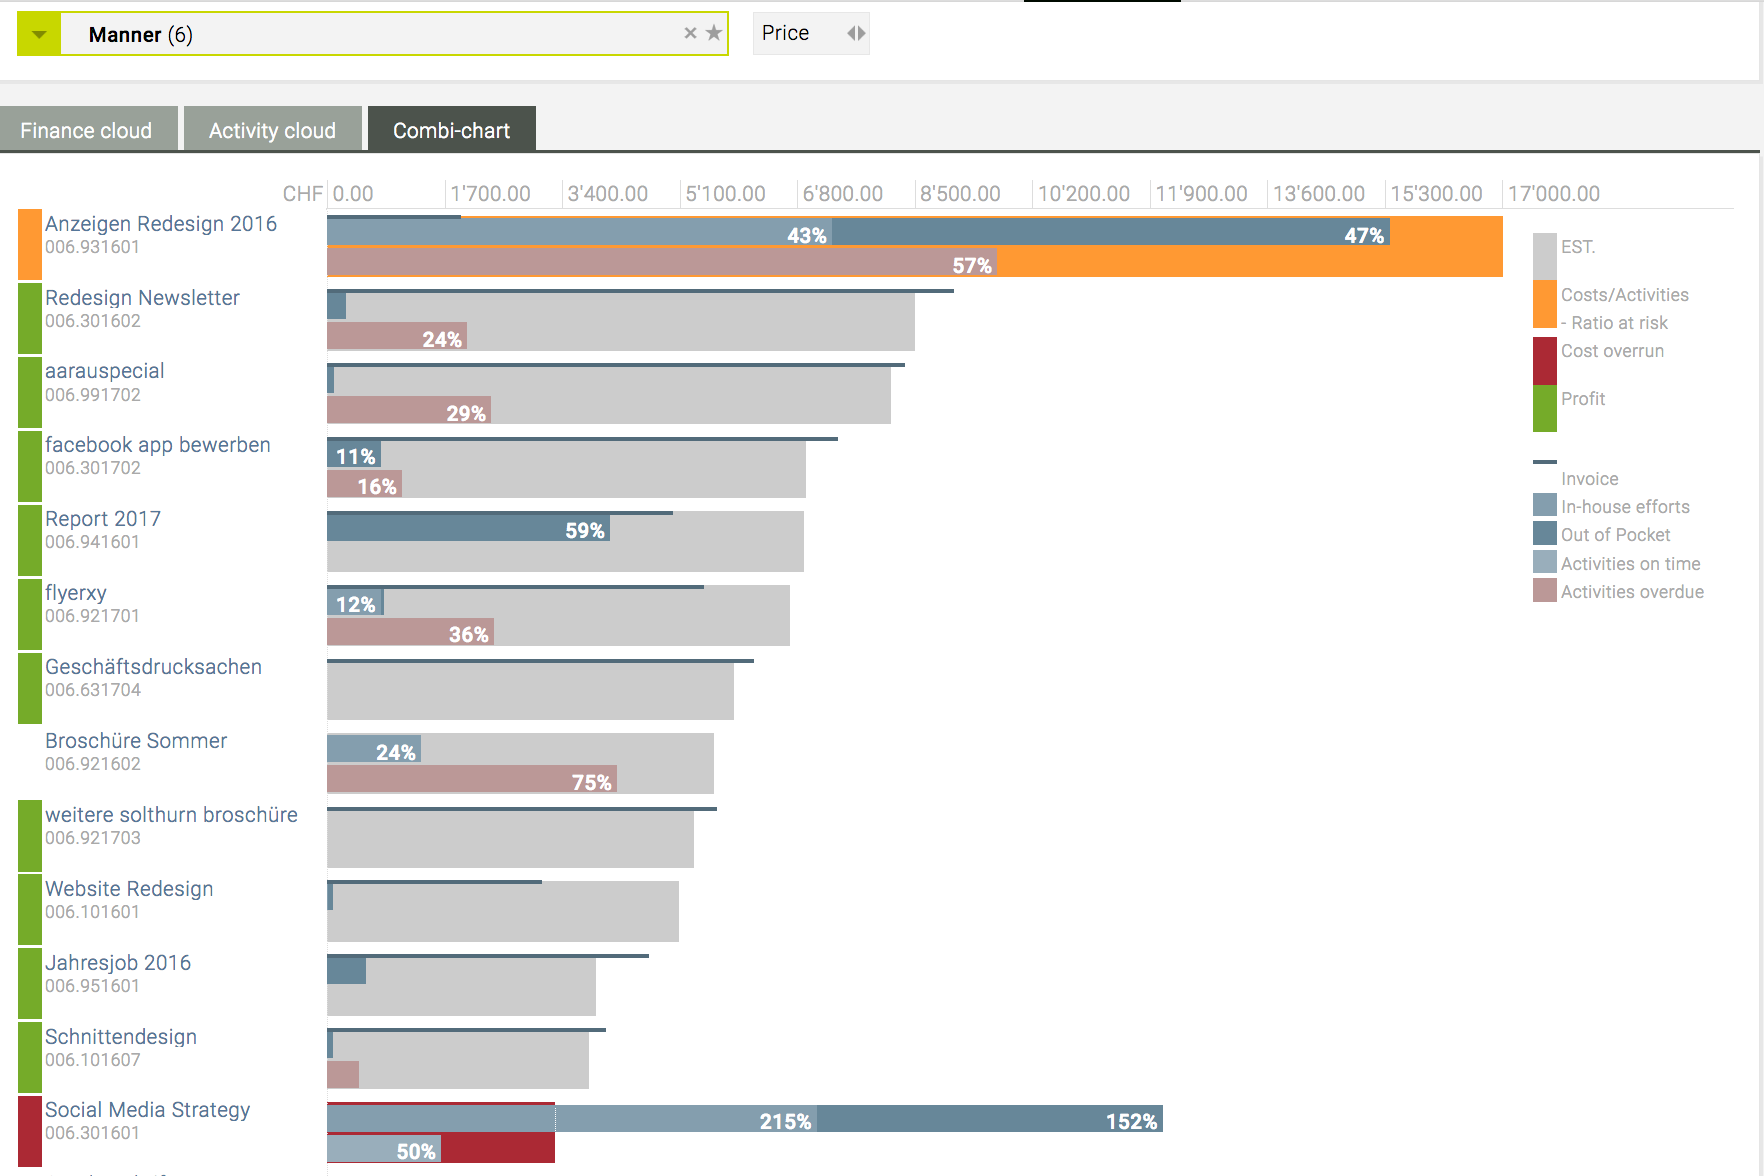
Combi-Chart
- Select a client (and, optionally, area)
- All active jobs are displayed
- The large progress bar in the background indicates the combined financial figures (i.e. limit) as set by the estimates – it is either grey (neutral), orange (to indicate immediate risk) or red (if the limits have been exceeded)
- Within that bar, three other bars illustrate more details
- Top bar: combined figures of in-house efforts and out-of-pocket invoices (including percentage showing in how far numbers match the approved estimate)
- Bottom bar (if applicable): approximate work progress in terms of planned activities
- Thin top line: already issued agency invoices
- Colour definitions (left end of each row):
- green: costs correlate with the approved estimate
- orange: costs are likely to exceed the approved estimate (already accumulated costs exceed 75% of the estimate and are disproportionate to already completed activities)
- red: already accumulated costs have already exceeded the approved estimate OR costs have been generated that do not have a corresponding offer (in the latter case, the warning “Costs without estimate” is displayed on the right)
- Clicking the bar shows more details
- Clicking the job title takes you to the job overview, displaying all the details for that job
- HINT: per default, all recorded staff efforts are displayed as prices. Users with adequate permissions can change this to a “cost view” rather than a “price view”: this will display the difference between approved estimate and costs (i.e. the marginal return) based on the staff costs.
HINT: if project management has not been activated, the combi chart can still be used, showing financial contexts only.